BAA (Batting Average Against) – The total batting average of all hitters against a pitcher.
BABIP (Batting Average on Balls in Play) – A hitter’s batting average on balls in play, excluding strikeouts and home runs. For pitchers, it is the average allowed. Batted-ball luck is generally random and can be a signifier of a player’s good or bad fortune.
BB% (Walk Rate) – The percent of plate appearances that end in a walk.
Betting Odds – Betting odds tell a bettor their return on a successful bet. For positive odds (+100, +250), a successful $100 bet will return the number specified in addition to the $100 that was originally bet. Example: A successful $10 bet at +180 odds will yield $28. For negative odds (-110, -200), the number specified is the wager required to win an additional $100. Example: A successful $10 bet at -110 odds will yield $19.
ERA- (ERA Minus) – A pitcher’s Earned Run Average when adjusted to league average and home ballpark. An ERA- of 100 is league average, lower numbers are better. Example: A pitcher with an ERA- of 90 is 10% better than league average, while an ERA- of 125 is 25% worse than league average. Popular websites such as Baseball Reference carry ERA+ (which is the same, just on a reverse scale), but I chose FanGraphs’ ERA- to remain consistent with the standard of low ERA -> better.
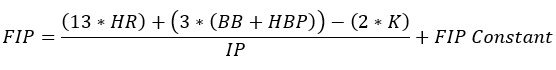
FIP (Fielding Independent Pitching) – Earned Run Average is not perfect, and FIP removes the inconsistencies that arise from team fielding discrepancies and batted ball luck by judging a pitcher solely on outcomes that they have full control over: strikeouts, walks, hit batters, and home runs. FIP is standardized to be on the same scale as ERA, and FIP can be a better estimate of a pitcher’s true ERA throughout a full season.
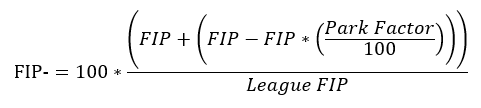
FIP- (FIP Minus) – Similar to ERA-, just with FIP
FPS% (First Pitch Strike Percentage) – The percent of first-pitches in a plate appearance that are strikes, including balls in play
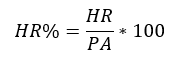
HR% (Home Run Rate) – The percent of plate appearances that result in home runs.
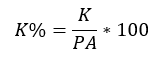
K% (Strikeout Rate) – The percent of plate appearances that result in a strikeout.
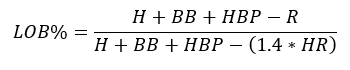
LOB% (Left on Base Percentage) – The percentage of a base runners that a pitcher strands on base. LOB% does not account for every base runner, only the ones that reached base because of the pitcher, so it excludes errors and inherited runners.
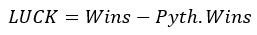
LUCK – The amount of extra, or fewer, games that a team has won when compared to their Pythagorean Standings.
Moneyline – The betting odds for a team to win the game.
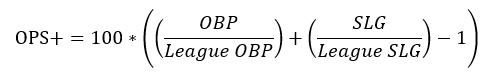
OPS+ (OPS Plus) – On-Base Plus Slugging when adjusted to league average and park factors. OPS+ is scaled to where league average is 100, with higher numbers being better. Similar to ERA-, an OPS+ of 110 is 10% better than league average.
Park Factors – The pitching or hitting adjustment given to a ballpark based on run environment. A hitter-friendly park will have a higher Park Factor greater than 100, while a pitcher friendly park, like C.O. Brown Stadium, will have a Park Factor less than 100. These factors are used to adjust advanced player performance metrics in order to put all players on a level playing field.
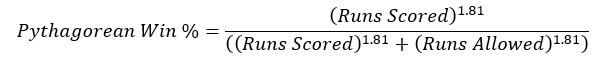
pythW-L (Pythagorean Record) – A team’s expected win loss record based on their runs scored and allowed. Generally eliminates luck and is a better benchmark of a team’s true performance in a season.
RE24 (Run Expectancy on 24 Base-Out States) – Using a Run Expectancy Matrix, this situation-based metric is a sum of the expect runs that a player has added to their team above average. Positive numbers are better for hitters, negative numbers are better for pitchers. This weighs every event on a true value scale. Example: A double with bases loaded and no outs is much more valuable than a double with bases empty and two outs.
Run Expectancy Matrix – A matrix that shows the expected runs for each of the 24 base-out states. By my syntax, a 0 indicates that the base is empty, while a 1,2, or 3 signifies an occupied base. Example: 100 is a runner on first, 023 is runners on second and third.
Run Line – A betting line that is designed to be a 50/50 point. The team that is the “favorite” will likely have a negative line, ex: -1.5. This is the number of runs to add or subtract to the final score before determining a winner. It is for betting purposes only, as there are no half-runs in baseball.
Run Probability Matrix – Similar to a Run Expectancy Matrix, but displays the probability of run scoring at any point after each of the 24 base-out states.
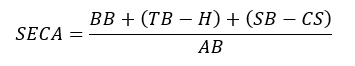
SECA (Secondary Average) – While batting average measures hits per at-bat, secondary average measures extra-bases gained independent to batting average per at-bat. It includes bases gained from Extra Base Hits, Walks, and Stolen Bases.
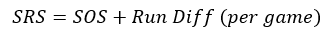
SOS (Strength of Schedule) – Used alongside SRS, SOS is the amount of runs per game better or worse of a team’s typical opponent.
SRS (Simple Rating System) – SRS is a metric created to provide a true indicator of a team’s performance by taking into account run differential and strength of schedule.
Total O/U – The number of total runs scored by both teams set for an over/under betting line. Typically adjusted to be at 50/50.
WAA (Wins Above Average) – My ultimate statistic for evaluating Northwoods League player performance. For hitters, wOBA is used to determine how many runs a player adds to his team above average. This number is added to an average team’s Pythagorean formula to indicate how many wins are added by the player’s performance. For pitchers, xR9 is used to determine how many runs a pitcher allows on the mound, and this adjusts the Pythagorean formula only for innings that the pitcher has appeared in. This indicated how many wins are added by the pitcher’s performance.
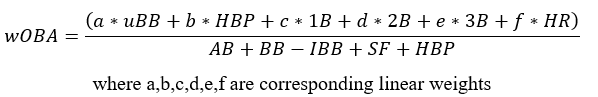
wOBA (Weighted On-Base Average) – OPS is simple to calculate but has faults, as OBP and SLG are not worth equal amounts. wOBA uses run expectancy to give linear weights to each offensive outcome, and combines this into one comprehensive number, which is weighted to the same scale as OBP.
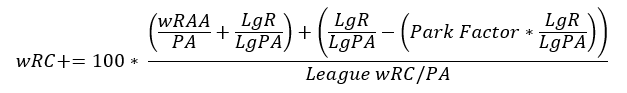
wRC+ (Weight Runs Created Plus) – Similar to OPS+, wRC+ uses wOBA to estimate how many runs a player creates, improving on the simple RC statistic. It is adjusted by park factors and scaled to put 100 at league average.
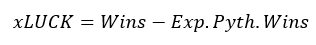
xLUCK (Expected Luck) – Similar to LUCK, just using my expected Pythagorean standings.
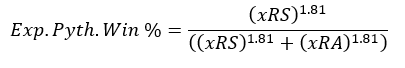
xpythW-L (Expected Pythagorean Record) – Similar to Pythagorean W-L, but uses expected runs in order to eliminate cluster luck.
xRA (Expected Runs Allowed) – Based on team data from 2017-2021, these expected run totals are created using an optimized linear model of simple statistics.
xRS (Expected Runs Scored) – Based on team data from 2017-2021, these expected run totals are created using an optimized linear model of simple statistics.